SLOs, SLAs, and Error Budgets: Running Reliable Services
SLOs, SLAs, and error budgets turn reliability into a measurable resource. Learn how to choose SLIs, set realistic targets, calculate error budgets, and implement burn rate alerts with Prometheus.
Infrastructure engineer with 10+ years building production systems on AWS, GCP,…
Reliability Is a Feature -- And It Has a Budget
Every production service fails. The question isn't whether your system will have downtime -- it's how much downtime is acceptable. SLOs, SLAs, and error budgets give you a framework for answering that question with numbers instead of gut feelings. They turn "we need to be more reliable" into "we have 43 minutes of downtime budget this month, and we've used 12."
Google's SRE book popularized these concepts, but most teams I've worked with either skip them entirely or implement them poorly -- setting targets they can't measure, confusing SLOs with SLAs, or treating error budgets as abstract metrics nobody acts on. This guide covers the practical side: how to choose the right SLIs, set realistic targets, and build alerts that actually enforce your reliability goals.
What Are SLIs, SLOs, and SLAs?
Definition: An SLI (Service Level Indicator) is a quantitative metric that measures service behavior. An SLO (Service Level Objective) is an internal reliability target expressed as a threshold on an SLI. An SLA (Service Level Agreement) is an external contract with customers that specifies consequences -- usually financial -- for failing to meet a reliability commitment.
Think of it as a stack: SLIs are the measurements, SLOs are the goals your engineering team works toward, and SLAs are the promises your business makes to customers. The relationship matters: your SLO should always be stricter than your SLA, giving you a buffer before you breach a contractual obligation.
SLIs: What You Measure
An SLI is a ratio of good events to total events, expressed as a percentage. The most common SLIs are:
| SLI Type | Good Event | Total Event | Example |
|---|---|---|---|
| Availability | Successful requests (non-5xx) | All requests | 99.95% of API requests return non-5xx |
| Latency | Requests under threshold | All requests | 99% of requests complete in under 200ms |
| Correctness | Correct responses | All responses | 99.99% of calculations return correct results |
| Freshness | Data updated within threshold | All data points | 99.9% of dashboard data is less than 60s old |
| Throughput | Requests processed within capacity | All requests | 99.9% of requests handled without queue overflow |
Pro tip: Measure SLIs from the user's perspective, not the server's. A load balancer returning 200 OK doesn't mean the user saw a working page -- the downstream service call might have failed silently. Use synthetic monitoring or real-user monitoring (RUM) to validate that your server-side SLIs match user experience.
SLOs: What You Target
An SLO sets a target percentage for your SLI over a time window. "99.9% availability over a rolling 30-day window" means you're allowed 43.2 minutes of downtime per month. Here's the math that matters:
| SLO Target | Allowed Downtime/Month | Allowed Downtime/Year | Typical Use Case |
|---|---|---|---|
| 99% (two nines) | 7.2 hours | 3.65 days | Internal tools, batch jobs |
| 99.9% (three nines) | 43.2 minutes | 8.77 hours | Most SaaS products |
| 99.95% | 21.6 minutes | 4.38 hours | Business-critical APIs |
| 99.99% (four nines) | 4.32 minutes | 52.6 minutes | Payment processing, auth services |
| 99.999% (five nines) | 26.3 seconds | 5.26 minutes | Core infrastructure (DNS, load balancers) |
Most teams should start with 99.9%. It sounds aggressive, but it gives you 43 minutes per month -- enough to handle a real incident without panicking. Going to 99.99% is exponentially harder and more expensive. Don't set that target unless the business absolutely requires it.
SLAs: What You Promise
An SLA is a business contract. It typically includes the reliability commitment, the measurement methodology, and the penalty for breach (usually service credits). SLAs should always be looser than your SLOs.
Example: Your internal SLO is 99.95% availability. Your SLA promises 99.9% to customers. This gives your team a 0.05% buffer -- about 22 minutes per month -- between "we're not meeting our internal goal" and "we owe customers money."
Watch out: Never set your SLA equal to your SLO. If your SLO is 99.9% and your SLA is 99.9%, any month you miss your internal target also triggers a contractual breach. You need a buffer between the two so the SLO serves as an early warning, not a simultaneous alarm.
Error Budgets: Making Reliability Actionable
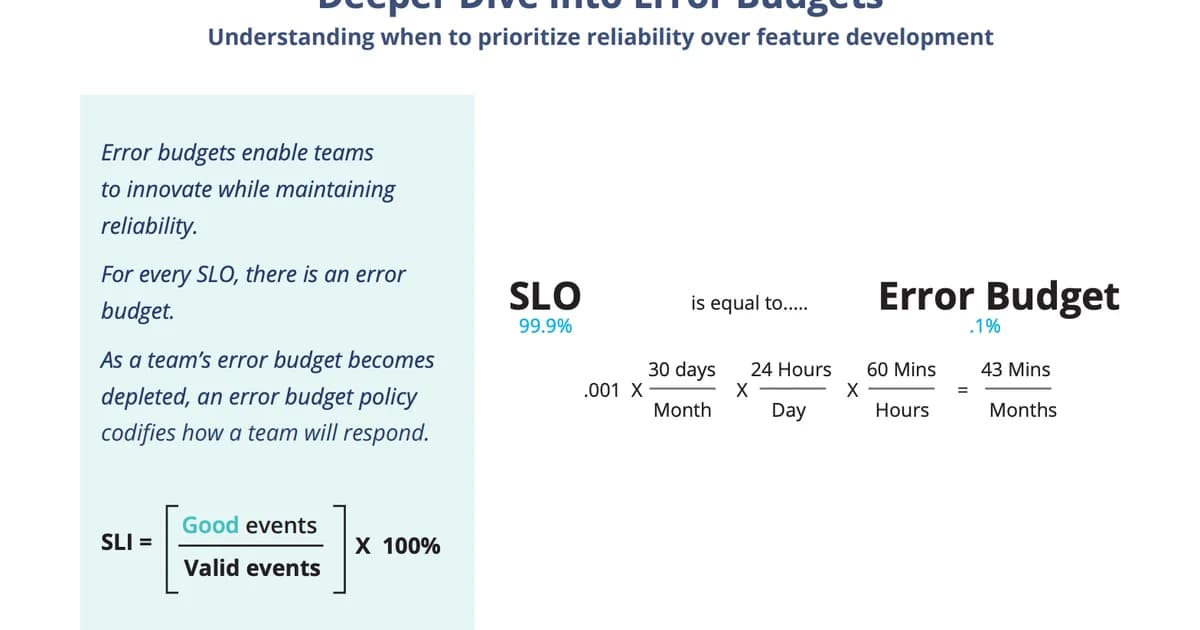
An error budget is the inverse of your SLO. If your SLO is 99.9% availability, your error budget is 0.1% -- which translates to 43.2 minutes of allowed downtime per month. The error budget is what makes SLOs practical instead of aspirational.
How Error Budgets Drive Decisions
The error budget creates a concrete tradeoff between reliability and velocity:
- Budget remaining: Your error budget has plenty left. Ship features aggressively. Deploy more often. Take calculated risks.
- Budget getting low: You've consumed 70%+ of your error budget. Slow down deployments. Prioritize stability work. Review recent changes for regressions.
- Budget exhausted: You've used 100% of your error budget. Freeze feature deployments. All engineering effort goes toward reliability improvements until the budget recovers in the next window.
This is the key insight: error budgets align incentives between product teams (who want to ship fast) and platform teams (who want stability). Instead of arguing about whether to prioritize features or reliability, you look at the number. Budget remaining? Ship. Budget gone? Fix.
# PromQL: Calculate remaining error budget for availability SLO
# SLO target: 99.9% over 30 days

# Total requests in the window
(sum(increase(http_requests_total[30d])))

# Failed requests (5xx)
(sum(increase(http_requests_total{status=~"5.."}[30d])))

# Error budget remaining (as a percentage of total budget)
1 - (
  sum(increase(http_requests_total{status=~"5.."}[30d]))
  /
  (sum(increase(http_requests_total[30d])) * 0.001)
)
Choosing the Right SLIs
Not every metric makes a good SLI. A good SLI is something users care about, something you can measure accurately, and something you can set a meaningful threshold on.
Step-by-Step Process for Defining SLIs
- Identify your critical user journeys. What are the 3-5 things users absolutely must be able to do? For an e-commerce site: browse products, add to cart, complete checkout, view orders.
- Map each journey to measurable indicators. Browse products = API availability + latency. Complete checkout = payment success rate + end-to-end latency.
- Define the "good event" threshold. A request is "good" if it returns a non-5xx response in under 200ms. A checkout is "good" if the payment succeeds within 5 seconds.
- Choose your measurement point. Measure at the load balancer or API gateway for availability. Use synthetic checks for end-to-end journey SLIs. Avoid measuring at the application level if your load balancer can mask failures.
- Validate with historical data. Before setting an SLO, check what your actual performance has been over the last 90 days. If you've been running at 99.7%, don't set an SLO of 99.99% -- you'll be in perpetual budget violation.
Pro tip: Start with two SLIs: availability (non-5xx ratio) and latency (p99 under threshold). These cover the vast majority of user-facing reliability concerns. Add correctness or freshness SLIs only when you have specific data integrity requirements.
Burn Rate Alerts
Traditional threshold alerts ("error rate > 1%") are noisy and don't account for your error budget. Burn rate alerts are smarter: they fire when you're consuming your error budget faster than expected.
How Burn Rate Works
A burn rate of 1x means you'll exactly exhaust your error budget at the end of the SLO window. A burn rate of 2x means you'll exhaust it in half the time. A burn rate of 10x means you'll blow through your monthly budget in 3 days.
# Prometheus alerting rules for multi-window burn rate alerts
groups:
  - name: slo-burn-rate
    rules:
      # Critical: 14.4x burn rate over 1 hour (budget gone in ~2 days)
      - alert: HighErrorBudgetBurn
        expr: |
          (
            sum(rate(http_requests_total{status=~"5.."}[1h]))
            /
            sum(rate(http_requests_total[1h]))
          ) > (14.4 * 0.001)
          and
          (
            sum(rate(http_requests_total{status=~"5.."}[5m]))
            /
            sum(rate(http_requests_total[5m]))
          ) > (14.4 * 0.001)
        for: 2m
        labels:
          severity: critical
        annotations:
          summary: "High error budget burn rate detected"
          description: "Error budget is burning at 14.4x. At this rate, the monthly budget will be exhausted in approximately 2 days."

      # Warning: 6x burn rate over 6 hours (budget gone in ~5 days)
      - alert: ElevatedErrorBudgetBurn
        expr: |
          (
            sum(rate(http_requests_total{status=~"5.."}[6h]))
            /
            sum(rate(http_requests_total[6h]))
          ) > (6 * 0.001)
          and
          (
            sum(rate(http_requests_total{status=~"5.."}[30m]))
            /
            sum(rate(http_requests_total[30m]))
          ) > (6 * 0.001)
        for: 5m
        labels:
          severity: warning
        annotations:
          summary: "Elevated error budget burn rate"
          description: "Error budget is burning at 6x the sustainable rate."
The multi-window approach (checking both a long window and a short window) prevents false positives. A brief spike that's already resolved won't trigger the long-window check. A sustained issue won't be missed because the short-window check catches it early.
SLO Implementation Costs
Implementing SLOs properly requires tooling investment. Here's what teams typically spend:
| Approach | Tools | Monthly Cost (est.) | Effort |
|---|---|---|---|
| DIY with Prometheus | Prometheus + Grafana + recording rules | $0 (self-hosted) | 2-4 weeks to set up, ongoing maintenance |
| Sloth (open source) | Sloth generates Prometheus rules from SLO specs | $0 | 1-2 days setup |
| Grafana Cloud SLO | Native SLO feature in Grafana Cloud | Included in Pro plan ($300+) | Hours to configure |
| Datadog SLO | Built-in SLO tracking | Included in Pro plan ($23/host+) | Hours to configure |
| Nobl9 / Reliability Platform | Dedicated SLO platform | $500-2,000+ | Days to integrate |
For most teams, the Sloth + Prometheus + Grafana combination is the sweet spot. Sloth generates all the recording rules and burn rate alerts from a simple YAML spec, and you get full SLO dashboards in Grafana without any vendor lock-in.
Frequently Asked Questions
What happens when the error budget is exhausted?
The standard response is to freeze feature deployments and redirect engineering effort toward reliability improvements. In practice, the severity depends on your organization. Some teams treat it as a hard freeze -- nothing ships until the budget recovers. Others treat it as a strong signal to prioritize stability work while allowing critical business features through with extra review. The key is deciding the policy before you need it, not during an incident.
Should every service have its own SLO?
No. Start with SLOs on your critical user journeys, not individual services. An SLO on "checkout completes in under 5 seconds with 99.9% success rate" is more meaningful than separate SLOs on the payment service, inventory service, and order service. Journey-level SLOs capture what users actually care about and avoid the overhead of maintaining dozens of service-level targets.
How do I handle dependencies that are less reliable than my SLO?
If your SLO is 99.9% but you depend on a third-party API that's only 99.5% reliable, you need mitigation: caching, fallbacks, retries with circuit breakers, or graceful degradation. Your SLO reflects what your users experience, not what your dependencies promise. If a dependency outage causes you to breach your SLO, that's your problem to solve architecturally.
What's the difference between a rolling and calendar-aligned SLO window?
A rolling window (e.g., "last 30 days") continuously recalculates. A calendar-aligned window (e.g., "this month") resets at the start of each period. Rolling windows are better for alerting because they don't create artificial urgency at month boundaries or false comfort after a reset. Calendar-aligned windows are better for reporting to stakeholders who think in monthly or quarterly terms. Use rolling for engineering, calendar for business.
How strict should my first SLOs be?
Start with SLOs that reflect your current performance minus a small buffer. If your service has been running at 99.95% availability over the last quarter, set your SLO at 99.9%. This gives you a realistic target that you're already meeting while leaving room for bad weeks. You can tighten SLOs later as you improve. Setting aspirational SLOs you can't meet creates alert fatigue and erodes trust in the system.
Do SLOs replace monitoring and alerting?
No. SLOs complement traditional monitoring. You still need alerts for infrastructure failures (disk full, pod crash loops, certificate expiration). SLO-based alerts tell you "users are being impacted at an unsustainable rate." Infrastructure alerts tell you "a specific component is broken." Both are necessary. SLO alerts catch the symptoms. Infrastructure alerts help you find the cause.
Conclusion
SLOs work because they turn reliability from an abstract goal into a measurable resource. Your error budget is a number. It goes up and down. When it's healthy, you ship fast. When it's low, you fix things. That simplicity is the entire point.
Start with one or two SLOs on your most critical user journeys. Use availability and latency as your SLIs. Set targets based on historical data, not ambition. Implement burn rate alerts instead of threshold alerts. And make sure your SLA is always looser than your SLO -- that buffer is what keeps your business commitments safe while your engineering team responds to issues.
Written by
Abhishek Patel
Infrastructure engineer with 10+ years building production systems on AWS, GCP, and bare metal. Writes practical guides on cloud architecture, containers, networking, and Linux for developers who want to understand how things actually work under the hood.
Related Articles
AIOps in 2026: AI-Driven Monitoring & Incident Response
AIOps in 2026 cuts alert noise 70-95% and Sev-2 MTTR 20-40% when layered on disciplined alerting. Landscape review of Dynatrace Davis, Datadog Watchdog, PagerDuty AIOps, BigPanda, and 6 more — with honest failure modes.
16 min read
ObservabilityBest Log Management Tools (2026): Splunk vs Datadog Logs vs Loki vs SigNoz
Benchmarked comparison of Splunk, Datadog Logs, Grafana Loki, and SigNoz on a 1.2 TB/day pipeline. Real 2026 pricing, query performance, and a cost-per-GB decision matrix.
15 min read
ObservabilityOpenTelemetry vs Datadog: Open Standard or Managed Platform?
Compare OpenTelemetry and Datadog across total cost of ownership, instrumentation, vendor lock-in, and architecture. TCO at 10, 50, and 200 services, OTel Collector pipeline config, hybrid approach, and a phased migration guide.
13 min read
Enjoyed this article?
Get more like this in your inbox. No spam, unsubscribe anytime.