OpenTelemetry: The Standard for Distributed Tracing in 2026
OpenTelemetry is the vendor-neutral standard for distributed tracing. Learn the OTel data model, auto-instrumentation, Collector pipelines, tail-based sampling, and how to choose between Jaeger, Tempo, Honeycomb, and Datadog.
Infrastructure engineer with 10+ years building production systems on AWS, GCP,…
How Distributed Tracing Got to OpenTelemetry: A Short, Honest Timeline
Distributed tracing did not start with OpenTelemetry. It started at Google in 2010 with the Dapper paper, which described how Google stitched together request traces across thousands of RPCs. Everything since has been the open-source world chasing that idea through five successive standards -- each one claiming to be the last.
- 2012 -- Zipkin (Twitter). First widely used open-source tracer. Introduced the B3 header format that is still in legacy systems a decade later. Each vendor wrote its own client library.
- 2016 -- OpenTracing. CNCF-hosted. Tried to standardize the tracing API so you could swap backends by changing one dependency. Traction was uneven; auto-instrumentation stayed fragmented.
- 2017 -- OpenCensus (Google). Covered tracing and metrics, shipped strong auto-instrumentation for Go and Java, but overlapped so much with OpenTracing that teams had to pick sides.
- 2019 -- OpenTelemetry announced. The two projects merged under CNCF specifically to stop the schism. Spec-first approach, clean SDK contracts, and a new wire protocol (OTLP) designed from scratch.
- 2021 -- Tracing SDK reaches GA. Vendors start shipping OTLP endpoints alongside their proprietary ones.
- 2023 -- Metrics spec GA. Prometheus remote-write compatibility lands; OTel becomes a plausible default for metrics too.
- Late 2024 -- Logs GA. The final pillar lands. For the first time, traces, metrics, and logs share a single SDK and a single exporter.
- 2026 (today). Every major backend -- Datadog, New Relic, Grafana Tempo, Honeycomb, AWS X-Ray -- accepts OTLP natively. OpenTracing and OpenCensus are archived. Instrumentation choice is no longer coupled to backend choice.
That history matters because it explains what OTel is and is not. OpenTelemetry is not a backend -- it does not store traces, it does not render flamegraphs. It is the plumbing layer the industry finally agreed on: an SDK, a spec, and a protocol (OTLP) that moves traces, metrics, and logs from your application to whatever backend you point it at. The rest of this guide is about using that plumbing well.
The OTel Data Model
Understanding OTel starts with understanding its core concepts: traces, spans, context propagation, and baggage.
Traces and Spans
A trace represents the full journey of a request through your system. It's a directed acyclic graph of spans. Each span represents a unit of work -- an HTTP request, a database query, a message publish. Spans have:
- Trace ID: A globally unique identifier shared by all spans in the trace
- Span ID: Unique to this span
- Parent Span ID: Links this span to its caller
- Name: A human-readable operation name (e.g.,
GET /api/users) - Start/End time: Duration of the operation
- Status: OK, ERROR, or UNSET
- Attributes: Key-value metadata (HTTP method, status code, database statement)
- Events: Timestamped annotations within the span (e.g., exception details)
Trace: abc123
  |
  +-- Span: API Gateway (parent)
       |   method: GET, path: /api/orders/42, status: 200, duration: 145ms
       |
       +-- Span: Auth Service
       |       duration: 12ms, cache_hit: true
       |
       +-- Span: Order Service
            |   duration: 128ms
            |
            +-- Span: PostgreSQL Query
            |       db.statement: SELECT * FROM orders WHERE id = 42
            |       duration: 23ms
            |
            +-- Span: Redis Cache Set
                    duration: 2ms
Context Propagation
Context propagation is how OTel carries trace context across service boundaries. When Service A calls Service B over HTTP, the trace ID and parent span ID get injected into HTTP headers. Service B extracts them and continues the same trace. OTel supports two propagation formats:
| Format | Header | Status |
|---|---|---|
| W3C Trace Context | traceparent, tracestate | W3C standard, default in OTel |
| B3 (Zipkin) | X-B3-TraceId, X-B3-SpanId | Legacy, still used in older systems |
W3C Trace Context is the default and what you should use unless you're interoperating with legacy Zipkin-instrumented services.
Baggage
Baggage is metadata that propagates across all services in a trace -- things like user ID, tenant ID, or feature flags. Unlike span attributes (which stay on one span), baggage travels through the entire request chain. Use it sparingly; every baggage entry adds bytes to every cross-service call.
Auto-Instrumentation vs. Manual Instrumentation
OTel offers two instrumentation approaches, and you'll typically use both.
Auto-instrumentation hooks into common libraries (HTTP clients, database drivers, message queues) and creates spans automatically. In Node.js, this means a single setup call instruments Express, pg, ioredis, and dozens of other libraries without changing application code.
Manual instrumentation lets you create custom spans for business logic that auto-instrumentation can't capture -- like tracking the duration of a machine learning inference call or a batch processing step.
Node.js Express Tutorial
Here's a complete setup for a Node.js Express application with auto-instrumentation:
- Install the packages.
npm install @opentelemetry/sdk-node \ @opentelemetry/auto-instrumentations-node \ @opentelemetry/exporter-trace-otlp-http \ @opentelemetry/exporter-metrics-otlp-http \ @opentelemetry/sdk-metrics - Create the instrumentation file. This must be loaded before your application code.
// tracing.ts import { NodeSDK } from '@opentelemetry/sdk-node'; import { getNodeAutoInstrumentations } from '@opentelemetry/auto-instrumentations-node'; import { OTLPTraceExporter } from '@opentelemetry/exporter-trace-otlp-http'; import { OTLPMetricExporter } from '@opentelemetry/exporter-metrics-otlp-http'; import { PeriodicExportingMetricReader } from '@opentelemetry/sdk-metrics'; const sdk = new NodeSDK({ serviceName: 'order-service', traceExporter: new OTLPTraceExporter({ url: 'http://otel-collector:4318/v1/traces', }), metricReader: new PeriodicExportingMetricReader({ exporter: new OTLPMetricExporter({ url: 'http://otel-collector:4318/v1/metrics', }), exportIntervalMillis: 15000, }), instrumentations: [ getNodeAutoInstrumentations({ '@opentelemetry/instrumentation-fs': { enabled: false }, }), ], }); sdk.start(); - Load it before your app.
node --require ./tracing.js ./app.js # Or with ts-node: node --require ./tracing.ts ./app.ts - Add manual spans for business logic.
import { trace } from '@opentelemetry/api';

const tracer = trace.getTracer('order-service');

async function processOrder(orderId: string) {
  return tracer.startActiveSpan('processOrder', async (span) => {
    try {
      span.setAttribute('order.id', orderId);

      const validated = await validateOrder(orderId);
      span.addEvent('order.validated');

      const charged = await chargePayment(orderId);
      span.addEvent('payment.charged');

      span.setStatus({ code: 1 }); // OK
      return charged;
    } catch (error) {
      span.setStatus({ code: 2, message: String(error) }); // ERROR
      span.recordException(error as Error);
      throw error;
    } finally {
      span.end();
    }
  });
}
Pro tip: Always call
span.end()in afinallyblock. Forgetting to end a span causes memory leaks and produces incomplete traces that are difficult to debug.
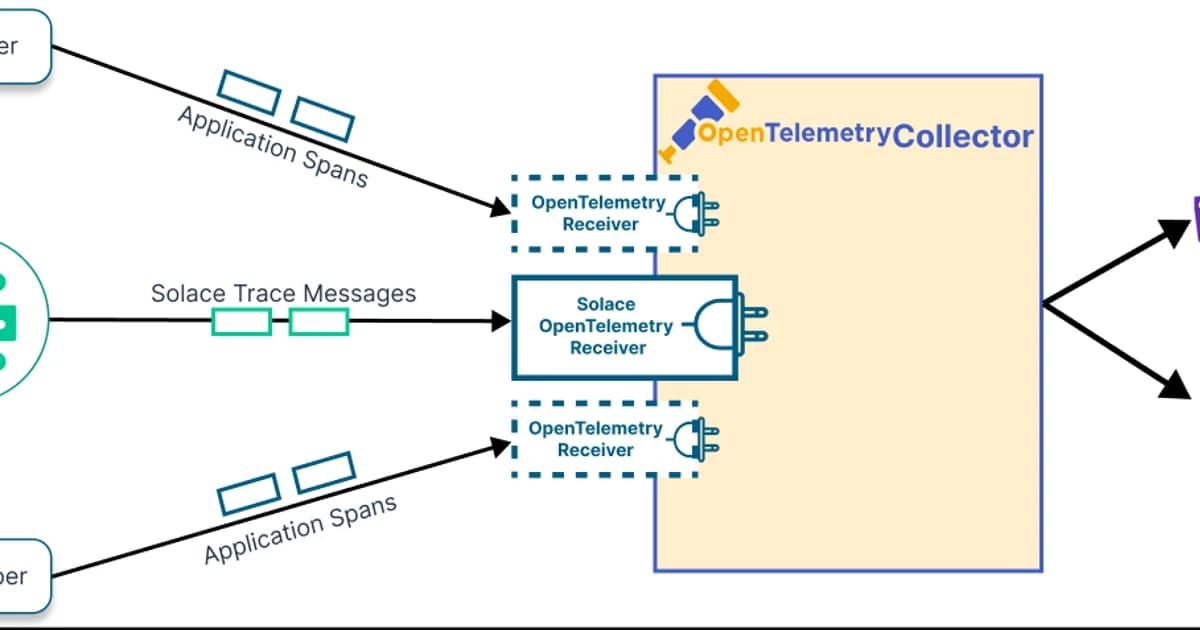
The OTel Collector Pipeline
The OpenTelemetry Collector is a vendor-agnostic proxy that sits between your applications and your backend. It receives telemetry, processes it (batching, filtering, sampling, enrichment), and exports it to one or more destinations.
# otel-collector-config.yaml
receivers:
  otlp:
    protocols:
      grpc:
        endpoint: 0.0.0.0:4317
      http:
        endpoint: 0.0.0.0:4318

processors:
  batch:
    timeout: 5s
    send_batch_size: 1024
  memory_limiter:
    check_interval: 1s
    limit_mib: 512
  attributes:
    actions:
      - key: environment
        value: production
        action: upsert
  tail_sampling:
    decision_wait: 10s
    policies:
      - name: error-traces
        type: status_code
        status_code: { status_codes: [ERROR] }
      - name: slow-traces
        type: latency
        latency: { threshold_ms: 1000 }
      - name: sample-rest
        type: probabilistic
        probabilistic: { sampling_percentage: 10 }

exporters:
  otlphttp/tempo:
    endpoint: http://tempo:4318
  otlphttp/honeycomb:
    endpoint: https://api.honeycomb.io
    headers:
      x-honeycomb-team: ${HONEYCOMB_API_KEY}

service:
  pipelines:
    traces:
      receivers: [otlp]
      processors: [memory_limiter, batch, attributes, tail_sampling]
      exporters: [otlphttp/tempo, otlphttp/honeycomb]
    metrics:
      receivers: [otlp]
      processors: [memory_limiter, batch]
      exporters: [otlphttp/tempo]
The collector is the right place for tail-based sampling. Your applications send 100% of spans to the collector, and the collector decides which traces to keep. This gives you all error traces, all slow traces, and a random sample of everything else -- without changing application code.
Backend Comparison
Once telemetry leaves the collector, it needs a backend for storage and querying. Here's how the major options compare:
| Backend | Type | Pricing Model | Best For |
|---|---|---|---|
| Jaeger | Open source, self-hosted | Infrastructure cost only | Teams already running Elasticsearch or Cassandra |
| Grafana Tempo | Open source, self-hosted or Cloud | Free self-hosted; Cloud from $0 | Teams in the Grafana ecosystem wanting object-storage-backed traces |
| Honeycomb | SaaS | Event-based ($0.20/1M events) | Teams prioritizing query power and high-cardinality exploration |
| Datadog APM | SaaS | Per host ($31/host/mo) + ingestion | Teams wanting an all-in-one platform with logs, metrics, and traces |
| AWS X-Ray | SaaS | Per trace ($5/1M traces) | AWS-native shops wanting minimal operational overhead |
Watch out: Trace storage costs can surprise you. A busy service generating 10,000 requests/second with 5 spans per trace produces 4.3 billion spans per day. Without sampling, you're looking at thousands of dollars per month on any SaaS backend. Always implement sampling in the collector.
How to Choose a Tracing Backend
The decision tree is simpler than vendors want you to think:
- Already using Grafana? Use Tempo. It integrates natively with Grafana, stores traces in object storage (cheap), and accepts OTLP directly.
- Need powerful ad-hoc querying? Use Honeycomb. Its query engine handles high-cardinality data better than anyone else, and the BubbleUp feature surfaces anomalies automatically.
- Want everything in one platform? Datadog or New Relic. You'll pay more, but you get logs, metrics, traces, profiling, and error tracking under one roof.
- Running on AWS and want simplicity? X-Ray works fine for basic tracing needs and requires zero infrastructure management.
- Want full control and have Elasticsearch? Jaeger is battle-tested and free. But operating Elasticsearch at scale is its own project.
Frequently Asked Questions
What is the difference between OpenTelemetry and OpenTracing?
OpenTracing was the original CNCF tracing standard. OpenCensus was Google's competing project for metrics and tracing. OpenTelemetry merged both projects into a single unified standard. OpenTracing and OpenCensus are deprecated -- all development has moved to OpenTelemetry. If you're on OpenTracing, OTel provides compatibility shims to migrate incrementally.
Does OpenTelemetry add latency to my application?
The overhead is measurable but small. Auto-instrumentation typically adds 1-3% latency per span. For most services, this is negligible. If you're building ultra-low-latency systems (sub-millisecond), you may want to benchmark carefully and disable instrumentations you don't need. The biggest performance concern is usually the exporter -- use the batch processor to avoid blocking your application on network calls.
Can I use OpenTelemetry with Datadog or New Relic?
Yes. Both Datadog and New Relic accept OTLP data natively. You can instrument with OpenTelemetry SDKs and export directly to their OTLP endpoints or route through the OTel Collector. This gives you vendor-neutral instrumentation while using a commercial backend. If you decide to switch vendors later, you only change the exporter configuration -- no application code changes.
What is tail-based sampling and when should I use it?
Tail-based sampling makes sampling decisions after a trace completes, rather than at the beginning. This lets you keep 100% of error traces and slow traces while sampling routine traffic. Use it when you want high fidelity for anomalies without the cost of storing everything. The OTel Collector supports tail-based sampling natively -- configure it in the processor pipeline.
How do I correlate traces with logs?
Inject the trace ID and span ID into your log context. Most OTel SDKs provide log bridge integrations that do this automatically. In your structured logs, include trace_id and span_id fields. Grafana can then link from a log entry directly to the corresponding trace in Tempo, and vice versa. This correlation is what turns separate pillars into a unified observability experience.
Is OpenTelemetry ready for production?
The tracing SDK and API are stable (GA) across all major languages. Metrics reached GA in 2023. Logs reached GA in late 2024. The Collector is production-ready and used at massive scale. The only area still evolving rapidly is profiling support, which is experimental. For traces and metrics, OTel is absolutely production-ready and used by thousands of companies in production today.
Conclusion
OpenTelemetry has won the instrumentation layer. The days of vendor-specific SDKs are over. Instrument once with OTel, export to any backend, and switch vendors with a configuration change -- not a code change.
Start with auto-instrumentation to get traces flowing immediately. Add manual spans for business-critical operations. Deploy the OTel Collector for sampling, enrichment, and multi-destination export. And choose your backend based on your team's existing stack and query needs, not on vendor sales pitches. The beauty of OTel is that your backend decision is no longer permanent -- you can always change it later.
Written by
Abhishek Patel
Infrastructure engineer with 10+ years building production systems on AWS, GCP, and bare metal. Writes practical guides on cloud architecture, containers, networking, and Linux for developers who want to understand how things actually work under the hood.
Related Articles
AIOps in 2026: AI-Driven Monitoring & Incident Response
AIOps in 2026 cuts alert noise 70-95% and Sev-2 MTTR 20-40% when layered on disciplined alerting. Landscape review of Dynatrace Davis, Datadog Watchdog, PagerDuty AIOps, BigPanda, and 6 more — with honest failure modes.
16 min read
DatabasesSQLite at the Edge: When libSQL Beats Postgres
SQLite at the edge via libSQL embedded replicas and Cloudflare D1 delivers 2-5ms reads worldwide versus 20-100ms for Postgres read replicas. Real benchmarks, pricing comparisons, production failure modes, and a decision framework for when edge SQLite wins and when Postgres-with-replicas is still the right call.
15 min read
ObservabilityBest Log Management Tools (2026): Splunk vs Datadog Logs vs Loki vs SigNoz
Benchmarked comparison of Splunk, Datadog Logs, Grafana Loki, and SigNoz on a 1.2 TB/day pipeline. Real 2026 pricing, query performance, and a cost-per-GB decision matrix.
15 min read
Enjoyed this article?
Get more like this in your inbox. No spam, unsubscribe anytime.