The Linux Networking Stack: From Socket to NIC
Trace a packet through the entire Linux networking stack: socket buffers, the TCP state machine, IP routing, netfilter/iptables, traffic control, and NIC drivers with practical diagnostic tools.
Infrastructure engineer with 10+ years building production systems on AWS, GCP,…
Pick the Row That Matches Your Symptom
Most Linux networking work starts with a symptom, not a layer. You don't wake up wanting to learn about sk_buff; you wake up with connection refused, a pegged NIC, or p99 latency that doubled after a kernel upgrade. This table maps the symptoms on-call actually sees to the layer of the stack that owns them, and the one tool you should reach for first. The rest of this guide is that table, unpacked.
| Symptom you're debugging | Where it lives | First tool to reach for | Red-flag signal |
|---|---|---|---|
Connection refused instantly | TCP / listener | ss -tlnp | No process bound to the port |
Connection timed out after ~2 min | netfilter / routing | iptables -L -v -n then tcpdump | SYN leaves, nothing ever comes back |
Sockets stuck in CLOSE_WAIT | Application + TCP | ss -tanp state close-wait | The app isn't calling close() |
Thousands of TIME_WAIT sockets | TCP teardown | ss -tan state time-wait | wc -l | Short-lived outbound connections without pooling |
| Random packet drops at high rate | NIC driver ring buffer | ethtool -S eth0 | rx_missed_errors / rx_fifo_errors climbing |
| Throughput stuck well below link speed | Socket buffers / congestion control | ss -ti, sysctl net.ipv4.tcp_rmem | cwnd small, rcv_space capped |
| Packets reach the host but never the app | netfilter INPUT chain | iptables -L INPUT -v -n | Packet counters on a DROP rule rising |
| Traffic goes out the "wrong" interface | IP routing / policy routing | ip route get <dst> | Route metric or source-based rule you forgot |
| Mysterious latency/jitter on one host | Traffic control (tc) | tc -s qdisc show dev eth0 | Leftover netem or tbf from a test |
| Docker container can't reach the internet | netfilter NAT + bridge | iptables -t nat -L -n -v | Missing MASQUERADE in POSTROUTING |
How to use this article: find your row above, jump to the section below that owns that layer, and stop there. You do not need to read the Linux networking stack end-to-end to fix a single issue. The layered walkthrough exists so the tool you reach for makes sense in context -- not so you have to consume it in order.
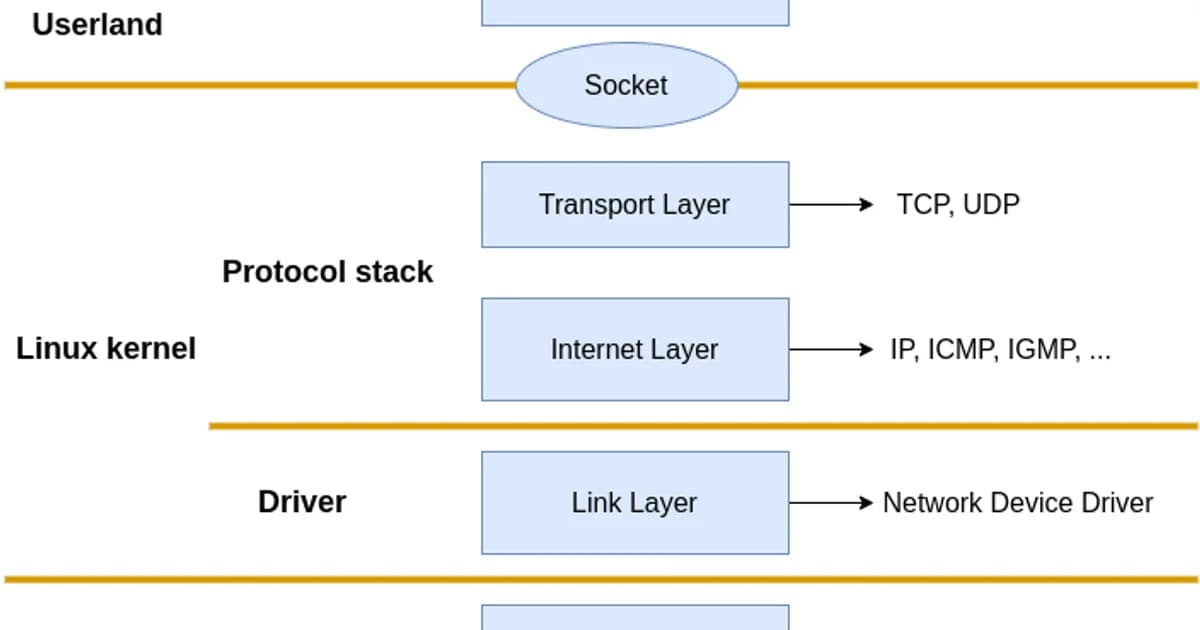
Layer by Layer: Socket to NIC
Here's the path a packet takes when your application sends data:
How a packet travels through the Linux networking stack
- Application calls send()/write() -- data is copied from userspace into a kernel socket buffer (sk_buff)
- TCP/UDP layer -- the transport protocol segments data, manages flow control, sets sequence numbers, handles retransmissions
- IP layer -- adds source/destination IP headers, performs routing lookup to determine the next hop and outgoing interface
- Netfilter -- the packet passes through iptables/nftables chains (OUTPUT for locally generated packets). NAT, filtering, and connection tracking happen here
- Traffic Control (tc) -- queuing disciplines shape outgoing traffic, enforce bandwidth limits, and prioritize packets
- NIC driver -- the packet is placed in the driver's transmit ring buffer and DMA'd to the network card hardware
- NIC hardware -- the physical NIC serializes the frame and transmits it on the wire
The reverse path for incoming packets hits the same layers in reverse order: NIC driver, tc (ingress), netfilter (PREROUTING, INPUT/FORWARD), IP routing, transport layer, socket buffer, application read().
Socket Buffers and the sk_buff
The sk_buff structure is the fundamental data unit in the Linux networking stack. Every packet in flight is wrapped in an sk_buff that carries the data plus metadata about the packet's journey through the stack.
# Check socket buffer sizes
sysctl net.core.rmem_default    # Default receive buffer
sysctl net.core.wmem_default    # Default send buffer
sysctl net.core.rmem_max        # Max receive buffer
sysctl net.core.wmem_max        # Max send buffer

# TCP-specific auto-tuning range (min, default, max)
sysctl net.ipv4.tcp_rmem
sysctl net.ipv4.tcp_wmem

# Check buffer usage for a specific connection
ss -tnm
Pro tip: Linux auto-tunes TCP buffer sizes between the min and max values in
tcp_rmem/tcp_wmem. For high-bandwidth, high-latency links (like cross-continent transfers), increasenet.core.rmem_maxandnet.core.wmem_maxto at least the bandwidth-delay product. A 1 Gbps link with 100ms RTT needs ~12 MB buffers to saturate.
The TCP State Machine
TCP connections move through well-defined states. Understanding these states is critical for debugging connection issues.
| State | Meaning | Common Issue |
|---|---|---|
LISTEN | Server waiting for connections | Port not listening = connection refused |
SYN_SENT | Client sent SYN, waiting for SYN-ACK | Firewall dropping SYN packets |
SYN_RECV | Server received SYN, sent SYN-ACK | SYN flood attack fills this queue |
ESTABLISHED | Connection active, data flowing | Normal operating state |
FIN_WAIT_1 | Sent FIN, waiting for ACK | Peer not responding to close |
FIN_WAIT_2 | Received ACK for FIN, waiting for peer's FIN | Peer hasn't closed its side |
TIME_WAIT | Waiting to ensure peer received final ACK | Too many can exhaust ports |
CLOSE_WAIT | Peer closed, waiting for application to close | Application bug -- not closing sockets |
# Count connections by state
ss -tan | awk '{print $1}' | sort | uniq -c | sort -rn

# Find connections in TIME_WAIT
ss -tan state time-wait | wc -l

# Find CLOSE_WAIT connections (potential leak)
ss -tanp state close-wait

# Check SYN backlog
ss -tnl  # Recv-Q column shows pending connections
Watch out: Large numbers of
CLOSE_WAITconnections almost always indicate an application bug. The remote side has closed the connection, but your application hasn't called close() on the socket. This won't fix itself -- the sockets stay open until the application closes them or the process exits. Check your connection pool configuration and error handling.
IP Routing
The IP layer decides where to send each packet based on the routing table.
# View the routing table
ip route show
# default via 10.0.0.1 dev eth0
# 10.0.0.0/24 dev eth0 proto kernel scope link src 10.0.0.5
# 172.17.0.0/16 dev docker0 proto kernel scope link src 172.17.0.1

# Trace which route a packet would take
ip route get 8.8.8.8
# 8.8.8.8 via 10.0.0.1 dev eth0 src 10.0.0.5

# Add a static route
sudo ip route add 192.168.1.0/24 via 10.0.0.1 dev eth0

# View the routing cache/FIB
ip route show cache
For servers with multiple interfaces or complex routing requirements, policy-based routing lets you route based on source address, mark, or incoming interface:
# Add a custom routing table
echo "100 custom" | sudo tee -a /etc/iproute2/rt_tables

# Add a rule: packets from 10.0.1.0/24 use the custom table
sudo ip rule add from 10.0.1.0/24 table custom

# Add a route to the custom table
sudo ip route add default via 10.0.1.1 dev eth1 table custom
Netfilter and iptables
Netfilter is the kernel framework for packet filtering. iptables (and its successor nftables) is the userspace tool for configuring it. Packets pass through chains of rules at specific hook points.
The five netfilter hooks
| Hook | Chain | When |
|---|---|---|
| PREROUTING | Before routing decision | All incoming packets hit this first |
| INPUT | After routing, destined for local process | Packets for this machine |
| FORWARD | After routing, destined for another machine | Packets being routed through |
| OUTPUT | Locally generated packets | Packets leaving from this machine |
| POSTROUTING | After routing decision, before NIC | All outgoing packets hit this last |
# List all rules with line numbers and packet counts
sudo iptables -L -n -v --line-numbers

# List NAT rules
sudo iptables -t nat -L -n -v

# Allow incoming SSH
sudo iptables -A INPUT -p tcp --dport 22 -j ACCEPT

# Block an IP
sudo iptables -A INPUT -s 203.0.113.100 -j DROP

# DNAT (port forwarding): forward port 80 to internal server
sudo iptables -t nat -A PREROUTING -p tcp --dport 80 -j DNAT --to-destination 10.0.0.10:8080

# SNAT: masquerade outbound traffic
sudo iptables -t nat -A POSTROUTING -o eth0 -j MASQUERADE

# View connection tracking table
sudo conntrack -L
Traffic Control (tc)
The tc subsystem manages queuing disciplines (qdiscs) that control how packets are scheduled for transmission. It's used for bandwidth limiting, latency simulation, and traffic prioritization.
# Show current qdisc on an interface
tc qdisc show dev eth0

# Add bandwidth limit of 100Mbps
sudo tc qdisc add dev eth0 root tbf rate 100mbit burst 32kbit latency 400ms

# Simulate 100ms latency (useful for testing)
sudo tc qdisc add dev eth0 root netem delay 100ms

# Simulate packet loss of 1%
sudo tc qdisc add dev eth0 root netem loss 1%

# Remove all tc rules
sudo tc qdisc del dev eth0 root

# View statistics
tc -s qdisc show dev eth0
NIC Driver Layer
The NIC driver manages ring buffers -- circular queues shared between the kernel and the network card hardware via DMA.
# View NIC driver and firmware info
ethtool -i eth0

# View ring buffer sizes
ethtool -g eth0

# Increase ring buffer size (reduces drops under load)
sudo ethtool -G eth0 rx 4096 tx 4096

# View NIC statistics (drops, errors, overruns)
ethtool -S eth0

# View interrupt coalescing settings
ethtool -c eth0

# Check for interface errors
ip -s link show eth0
Pro tip: If
ethtool -S eth0showsrx_missed_errorsorrx_fifo_errorsincrementing, your ring buffers are too small -- the NIC is receiving packets faster than the kernel can process them. Increase ring buffer size withethtool -Gand check that IRQ affinity spreads the load across CPU cores.
Diagnostic Tools Summary
| Layer | Tool | What It Shows |
|---|---|---|
| Application | ss -tnp | Socket states, connected processes |
| TCP | ss -ti | TCP internals: RTT, congestion window, retransmits |
| IP Routing | ip route get | Which route a packet takes |
| Netfilter | iptables -L -v -n | Firewall rules and packet counts |
| Traffic Control | tc -s qdisc show | Queue statistics and drops |
| NIC | ethtool -S | Hardware-level counters |
| Packets | tcpdump | Raw packet capture |
# tcpdump: capture packets on port 443
sudo tcpdump -i eth0 port 443 -nn -c 100

# tcpdump: capture and save to file for Wireshark analysis
sudo tcpdump -i eth0 -w capture.pcap -c 1000

# tcpdump: show TCP flags
sudo tcpdump -i eth0 'tcp[tcpflags] & (tcp-syn|tcp-fin) != 0' -nn
Network Infrastructure and Cloud Costs
Understanding the networking stack helps you optimize cloud network costs:
| Provider | Egress Cost | Free Tier | Notes |
|---|---|---|---|
| AWS | $0.09/GB (first 10 TB) | 100 GB/month (12 months) | Inter-AZ: $0.01/GB each way |
| GCP | $0.08-0.12/GB | 200 GB/month | Free egress to same zone |
| Azure | $0.087/GB (first 10 TB) | 100 GB/month (12 months) | Free within same region |
| Hetzner | Included (20 TB) | 20 TB included | By far the cheapest for bandwidth |
| Cloudflare | Free (on CDN/Workers) | Unlimited | No egress fees on Cloudflare products |
Frequently Asked Questions
What causes TIME_WAIT connections to pile up?
TIME_WAIT occurs on the side that initiates the connection close. It lasts for 2x the Maximum Segment Lifetime (typically 60 seconds). High-traffic servers that make many short-lived outbound connections (like to databases or APIs) accumulate TIME_WAIT sockets. Mitigations include connection pooling, enabling tcp_tw_reuse, and using keep-alive connections.
How do I trace the path of a packet through iptables?
Use the TRACE target: iptables -t raw -A PREROUTING -p tcp --dport 80 -j TRACE and iptables -t raw -A OUTPUT -p tcp --dport 80 -j TRACE. Then watch dmesg or journalctl -k for trace output showing which chain and rule each packet hits. Remember to remove TRACE rules when done -- they generate massive amounts of log data.
What is the difference between iptables and nftables?
Nftables is the successor to iptables. It uses a single tool (nft) instead of separate commands for each table (iptables, ip6tables, ebtables). nftables has better performance through a virtual machine that evaluates rules, supports atomic rule replacement, and has a cleaner syntax. Most distributions now use nftables with an iptables compatibility layer.
How do I increase network throughput on Linux?
Check these in order: increase socket buffer sizes (net.core.rmem_max, net.core.wmem_max), increase NIC ring buffers (ethtool -G), enable receive-side scaling (RSS) for multi-queue NICs, tune TCP congestion control (bbr is often better than cubic), and check for errors with ethtool -S. The bandwidth-delay product determines the minimum buffer size needed.
What does "connection refused" vs "connection timed out" mean?
Connection refused means a TCP RST was received -- the host is reachable but nothing is listening on that port. Connection timed out means no response at all -- the host is down, a firewall is dropping packets, or the route is broken. "Refused" is fast and definitive. "Timed out" requires waiting for the timeout period (often 120+ seconds).
How does Docker networking work under the hood?
Docker creates a bridge interface (docker0), assigns each container a veth pair (one end in the container's network namespace, one end on the bridge), and uses iptables NAT rules to route traffic between containers and the host network. Container-to-container communication goes through the bridge. External traffic uses MASQUERADE in POSTROUTING.
Conclusion
The Linux networking stack is layered, and debugging it requires matching the right tool to the right layer. Use ss for socket and TCP state issues. Use ip route for routing problems. Use iptables -L -v and conntrack for firewall issues. Use ethtool for NIC-level drops. And when all else fails, tcpdump shows you what's actually on the wire. Trace the packet path from application to NIC, check each layer, and the problem will reveal itself.
Written by
Abhishek Patel
Infrastructure engineer with 10+ years building production systems on AWS, GCP, and bare metal. Writes practical guides on cloud architecture, containers, networking, and Linux for developers who want to understand how things actually work under the hood.
Related Articles
Can You Run LLMs Without GPU? CPU Benchmarks & Reality Check
A deep dive into running large language models on CPUs. Includes performance benchmarks, limitations, and optimization strategies.
10 min read
NetworkingMacvlan and IPvlan in Docker: When to Use Each
Macvlan gives containers unique MACs (each looks like a physical machine); IPvlan shares the host MAC. Real use cases (legacy apps, hardware licensing, multi-tenant), gotchas (host can't reach containers, AWS blocks them), and configuration recipes.
12 min read
CloudCheapest VPS Providers in India (2026)
Compare the cheapest VPS providers with Indian data centres. INR pricing with GST, latency benchmarks from Indian cities, UPI payment options, and CERT-In compliance guidance.
11 min read
Enjoyed this article?
Get more like this in your inbox. No spam, unsubscribe anytime.